NOTICE: Positron is now in the DAT Linux control panel. Update your systems to refresh the applications.
sudo apt update && sudo apt upgrade

|
Introducing DAT Linux PRO tools. Enhance your DAT Linux with extra power-tools including: back-up/restore; update notifications; app monitoring; custom links; dark theme; R pkg manager; datasets assistant; e-books assistant. One payment, perpetual license. (Student & Educator discounts!!)
|
Introduction
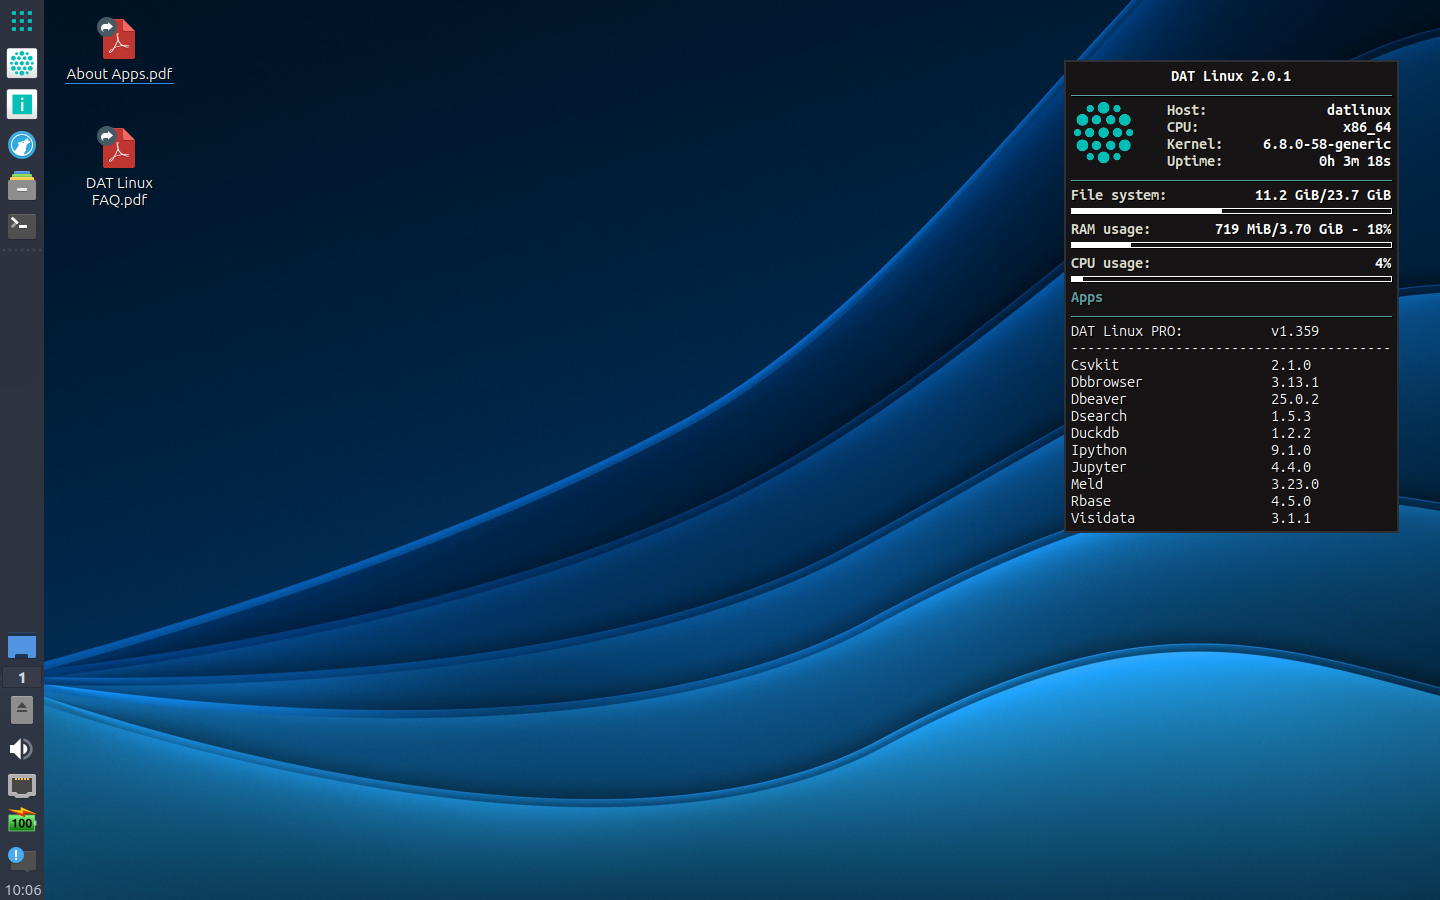
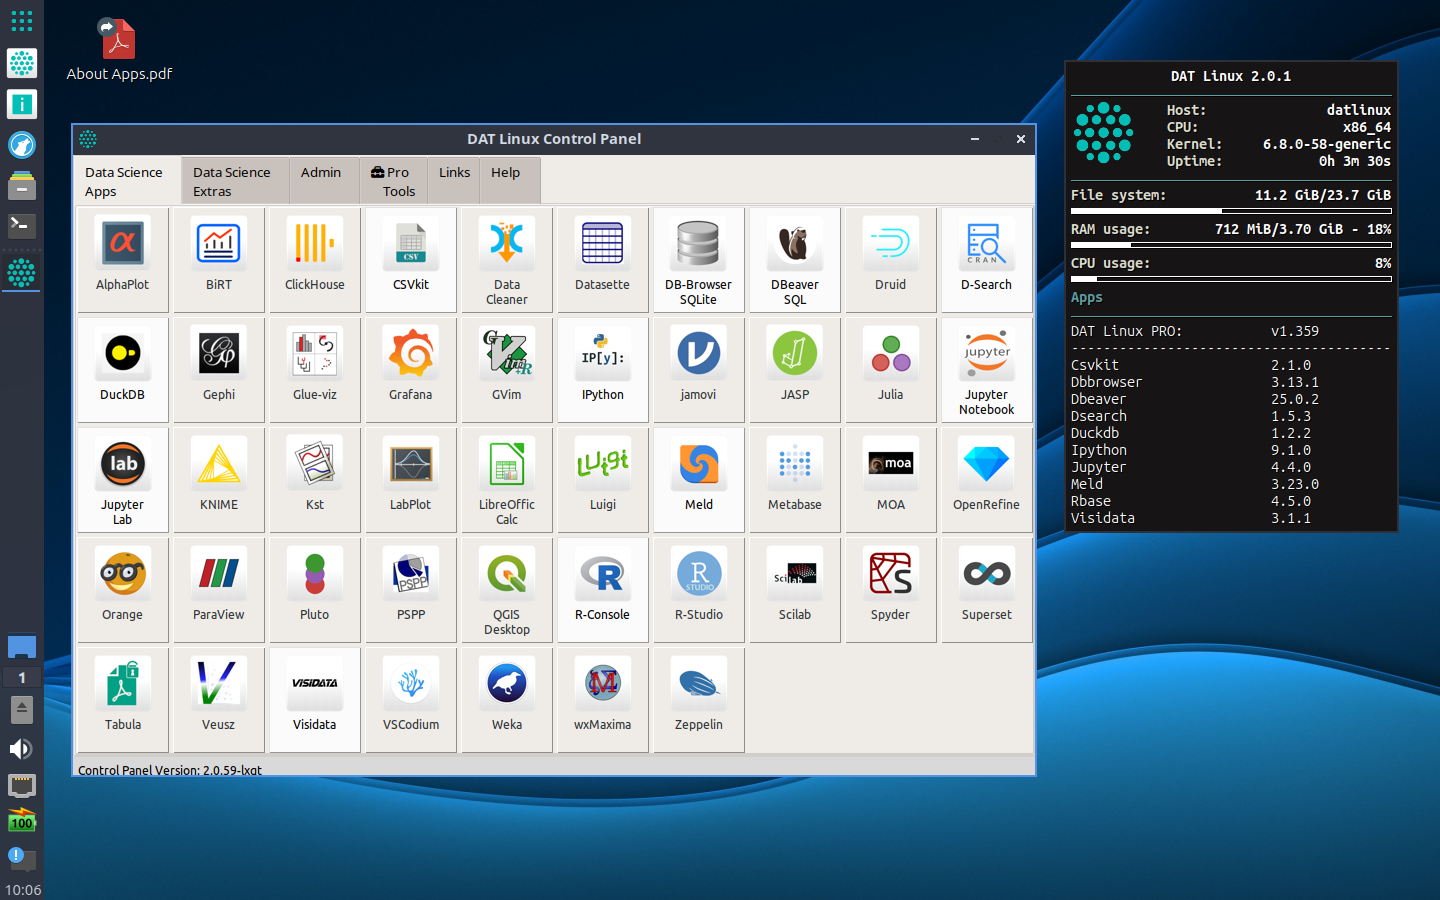
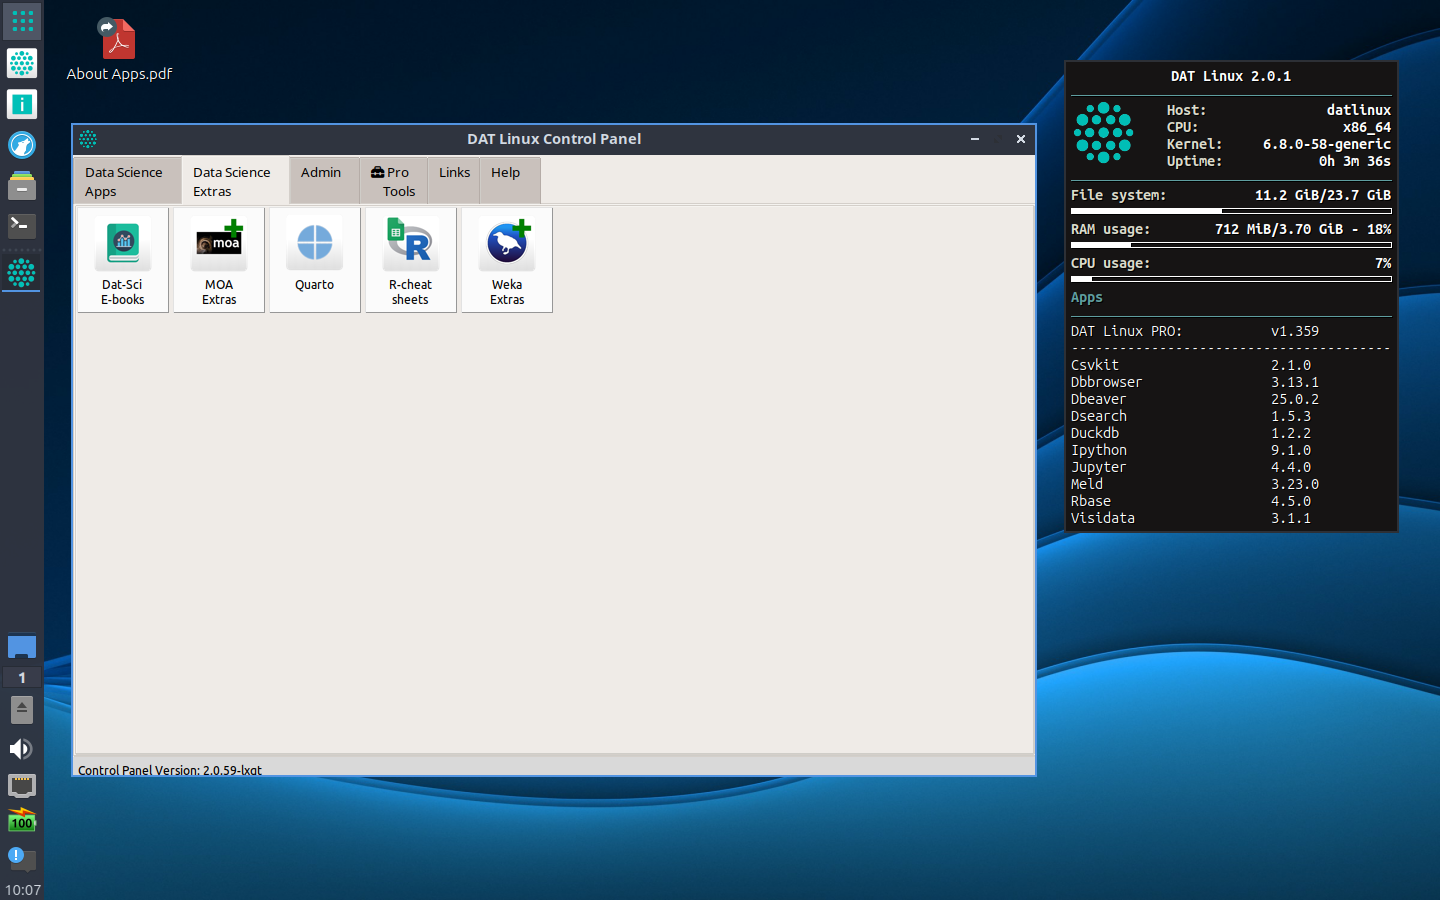
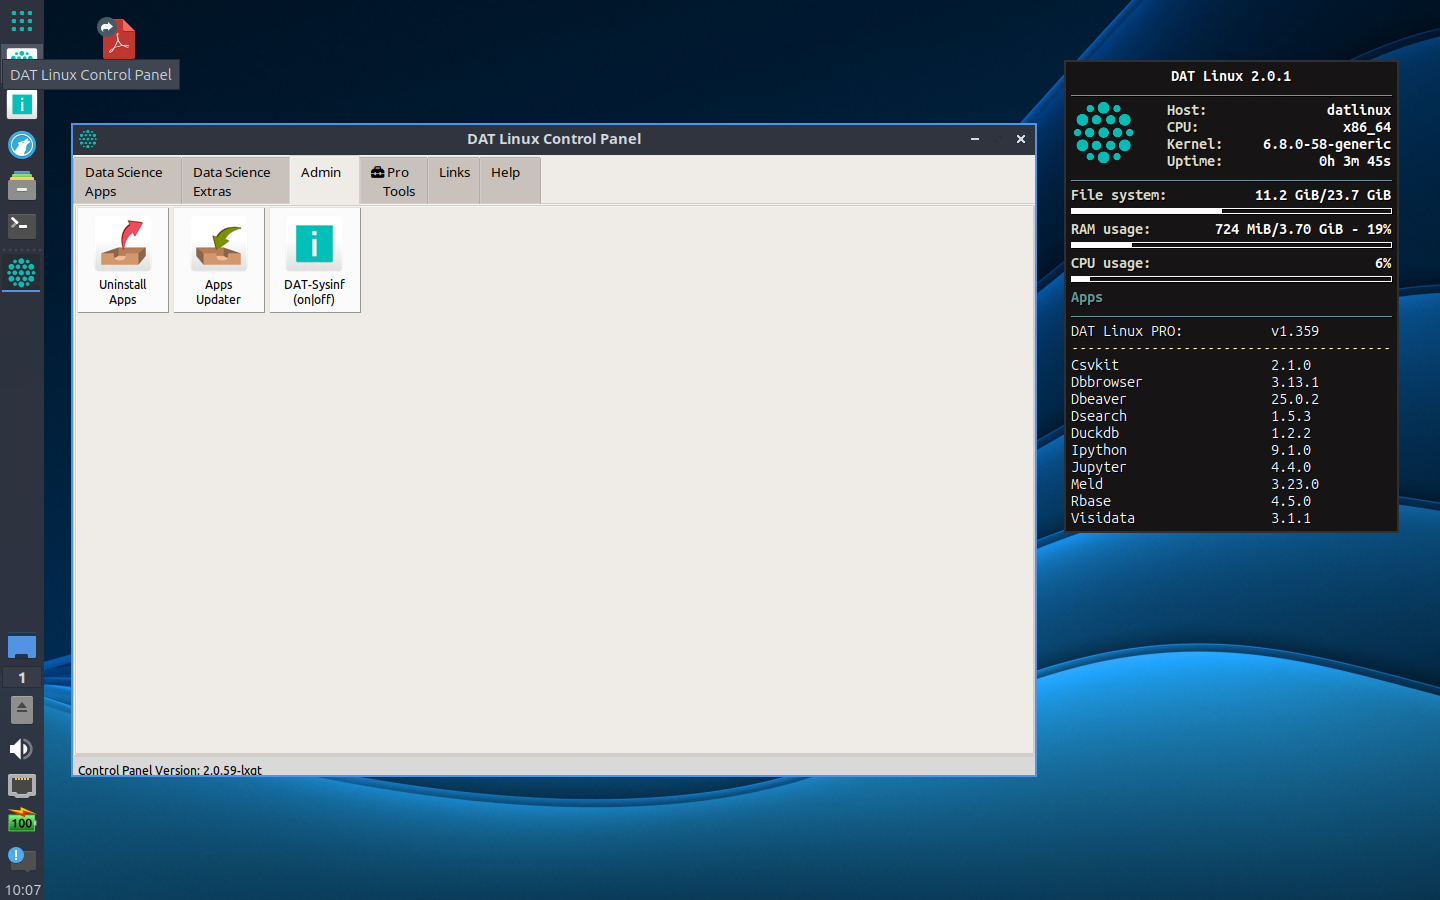
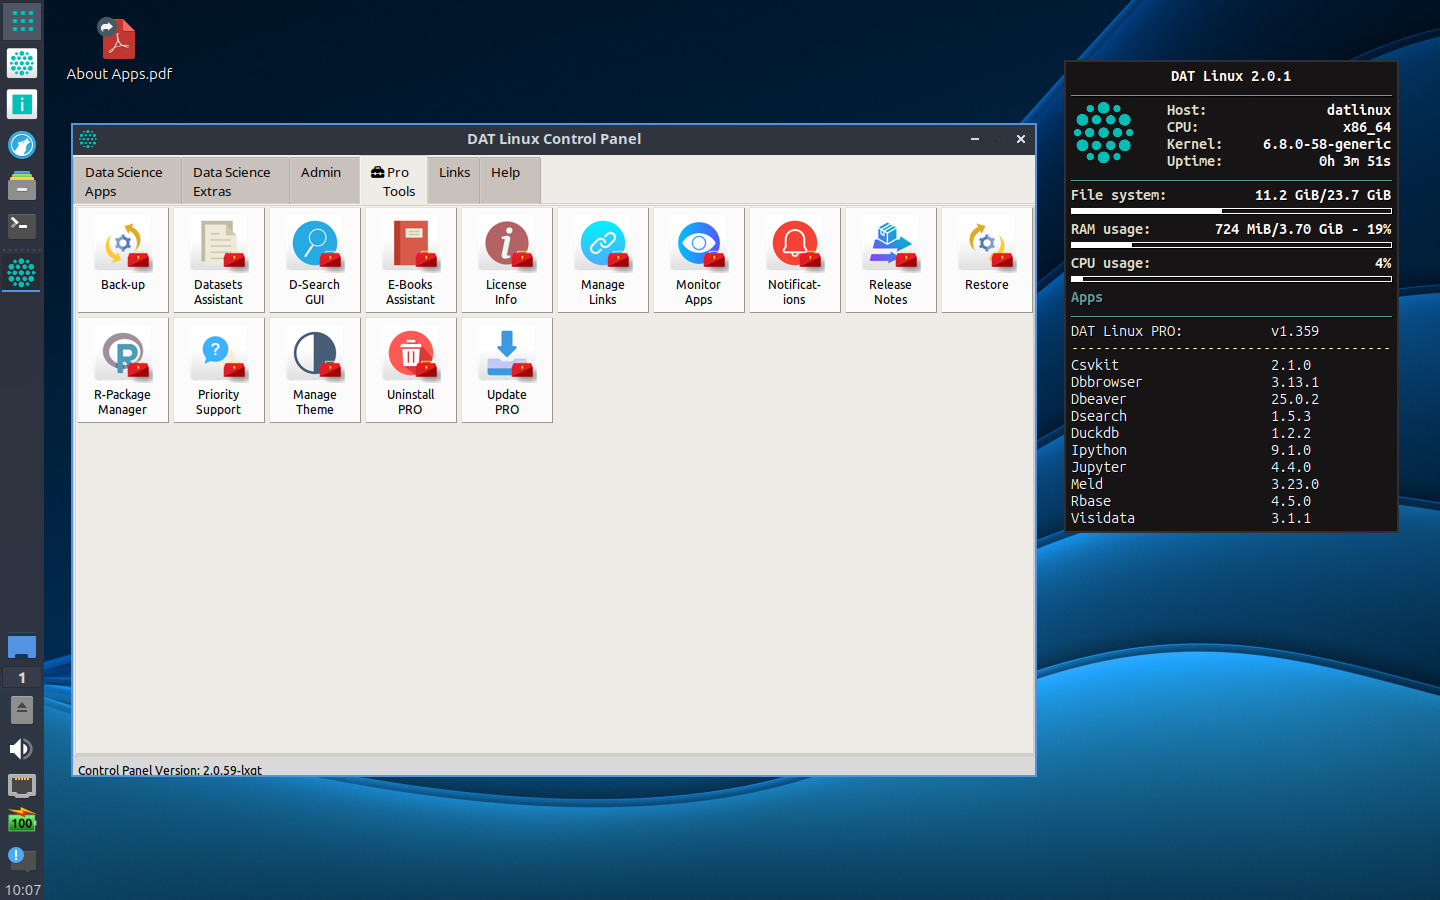
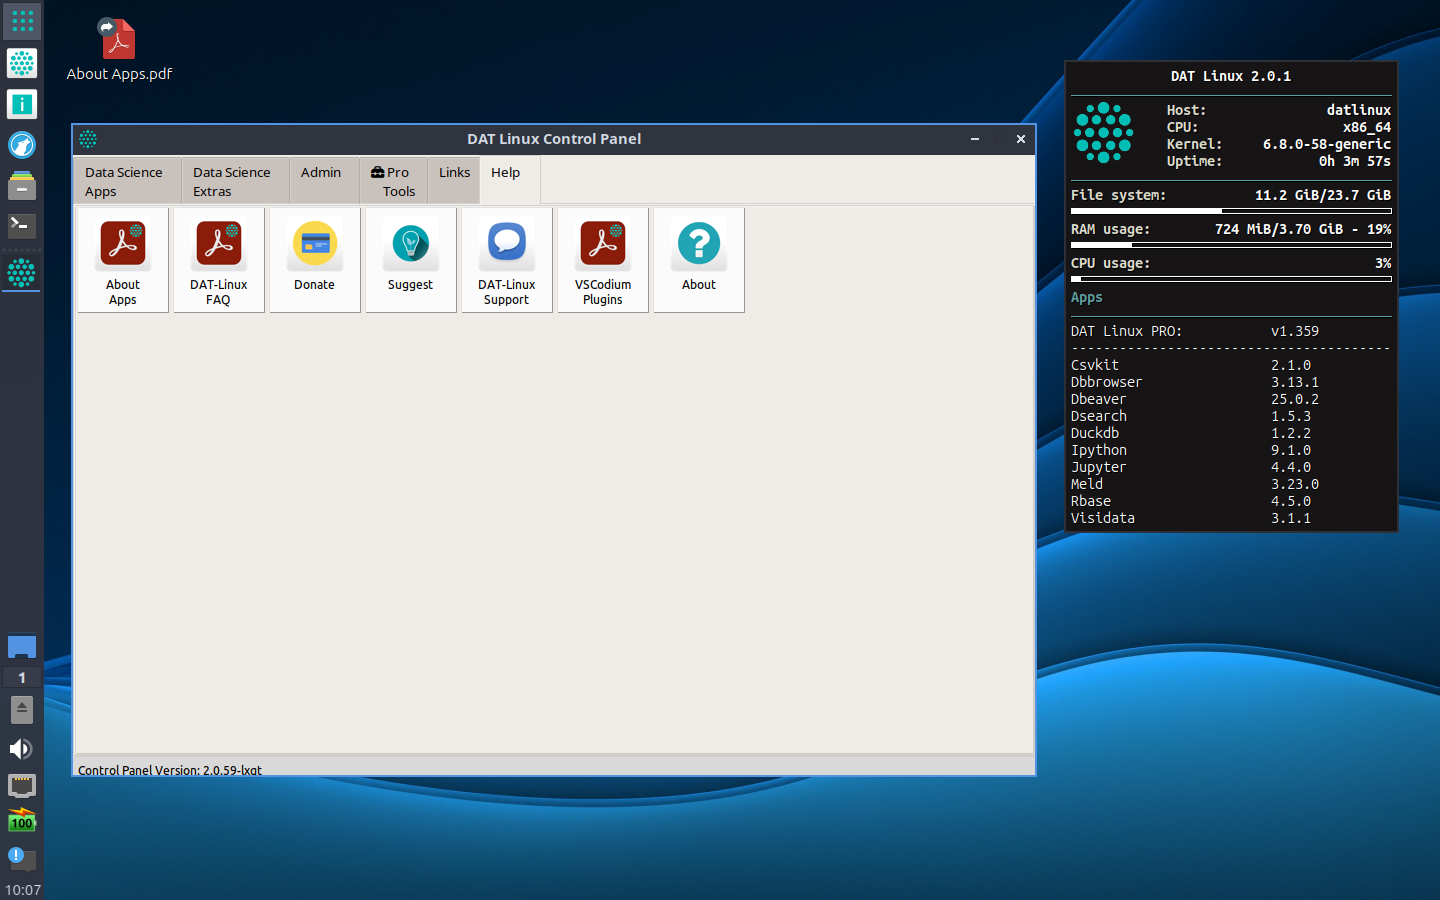
DAT Linux is a Linux distribution for data science. It brings together all your favourite open-source data science tools and apps into a ready-to-run desktop environment. It’s based on Ubuntu 24.04 LTS, so it’s easy to install and use. The custom DAT Linux Control Panel provides a centralised one-stop-shop for running and managing dozens of data science programs. Read the FAQ.
DAT Linux is perfect for students, professionals, academics, or anyone interested in data science who doesn’t want to spend endless hours downloading, installing, configuring, and maintaining applications from a range of sources, each with different technical requirements and set-up challenges.

|
Featured e-book: NUMPY BY EXAMPLE - A Beginner's Guide to Learning NumPy (updated for NumPy 2) by the DAT Linux team.
🛒️ BUY the PDF or EPUB e-book from Leanpub. |
Screenshots
Get started
-
⬇️ Download DAT Linux, and get on with doing data science without the headaches.
-
ℹ️ FAQ for more answers to some questions you may have.
-
💬️ Github Community channel for annoucements, or to post any feedback, issues or general queries.
List of supported data science apps
💳️ Please subscribe/donate to help support DAT Linux development
| App | Description | |
|---|---|---|
| AlphaPlot | AlphaPlot is an open-source computer program for interactive scientific graphing and data analysis. | |
| BiRT | Eclipse BIRT™ is an open source reporting system for producing compelling BI reports | |
| ClickHouse | ClickHouse is an open-source column-oriented DBMS for online analytical processing | |
| Data Cleaner | Data Quality toolkit that allows you to profile, correct, and enrich your data | |
| Datasette | Datasette is a tool for exploring and publishing data visually and with SQL | |
| DB Browser | DB Browser for SQLite is a visual, open source tool to create, design, and edit database files compatible with SQLite | |
| DBeaver | Free multi-platform database tool for developers, database administrators, analysts and all people who need to work with databases | |
| Druid | Apache Druid is a real-time database to power modern analytics applications | |
| D-Search | Convenient interface to the “webtools” R package to search for datasets in –all– CRAN packages | |
| DuckDB | DuckDB is an in-process SQL OLAP database management system | |
| Gephi | Gephi is the leading visualization and exploration software for all kinds of graphs and networks | |
| Glue-viz | Glue is a UI and Python library to explore relationships within and among related datasets | |
| Grafana | Grafana is a popular open-source platform for data visualization and monitoring | |
| G-Vim | A GUI wraper for the Vim screen-based text editor program, with plugins for R installed | |
| IPython | A command shell for interactive computing with a convenient console launcher | |
| Julia | Julia is a high-level, high-performance, dynamic programming language | |
| Jamovi | jamovi is a new “3rd generation” statistical spreadsheet. And a compelling alternative to SPSS and SAS. | |
| JASP | JASP is a cross platform statistical software program with a state-of-the-art graphical user interface. | |
| Jupyter Notebook | The Jupyter Notebook is a web-based interactive, scientific computing platform | |
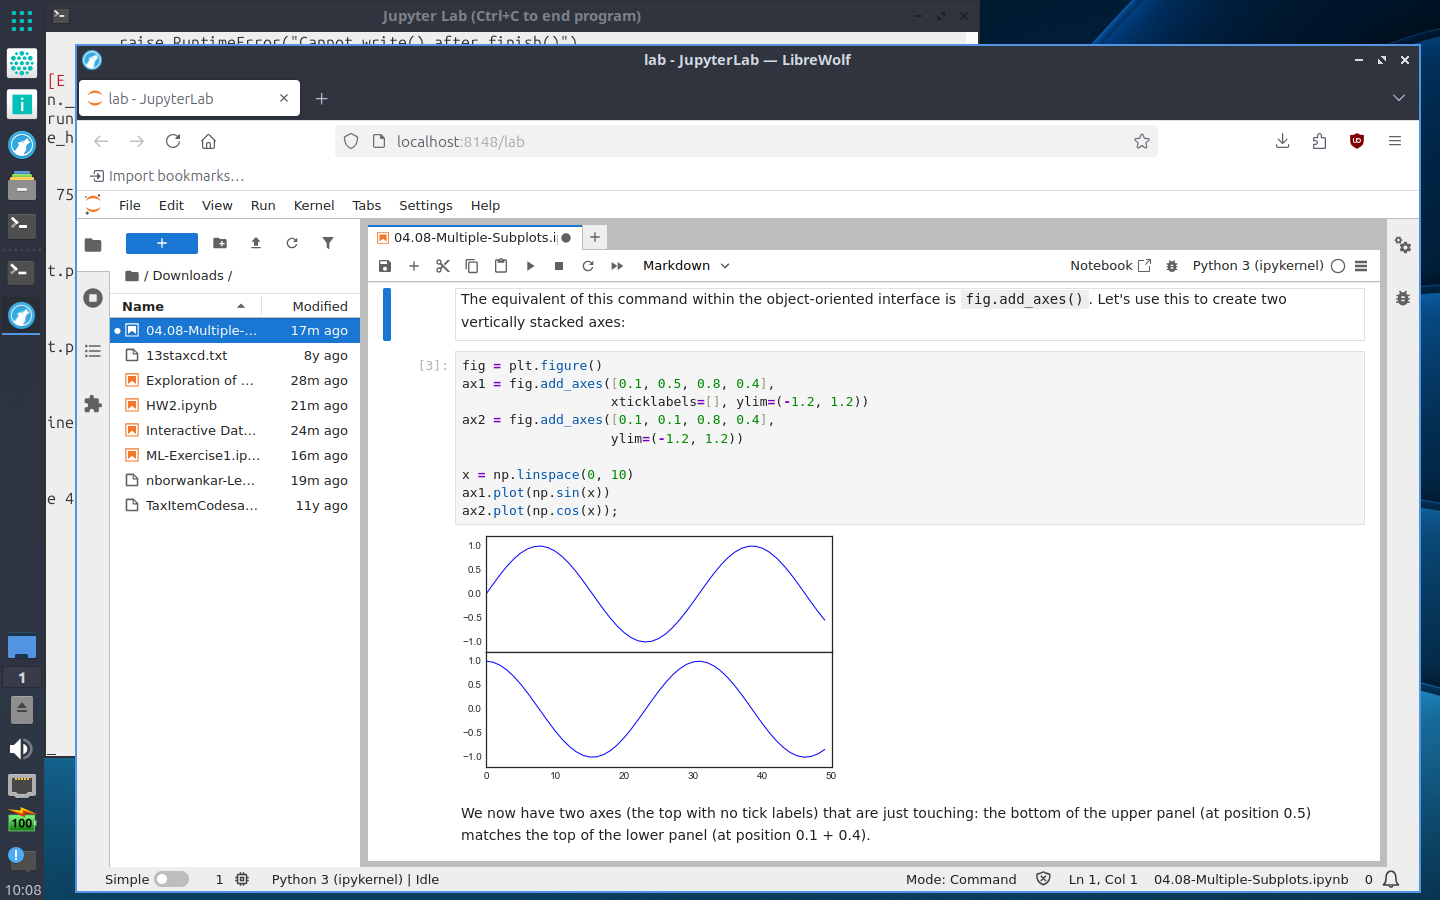
| Jupyter Lab | JupyterLab is the latest web-based interactive development environment for notebooks, code, and data | |
| KNIME | KNIME Analytics Platform is open source software for data science | |
| kst | Kst is a fast real-time large-dataset viewing and plotting tool available with built-in data analysis. | |
| LabPlot | Free, open source and cross-platform Data Visualization and Analysis software accessible to everyone | |
| LibreOffice Calc | LibreOffice Calc is the spreadsheet component of the LibreOffice software package | |
| Luigi | Luigi provides a framework to develop and manage data processing pipelines | |
| Meld | Meld is a visual file diff and merge tool | |
| Metabase | Metabase is an open-source business intelligence tool | |
| MOA | MOA is an open source framework for Big Data stream mining. It includes a collection of machine learning algorithms | |
| OpenRefine | OpenRefine is an open-source desktop application for data cleanup and transformation to other formats | |
| Orange | Orange is a powerful platform to perform data analysis and visualization | |
| Paraview | ParaView is an open-source, multi-platform data analysis and visualization application | |
| Pluto | A Pluto notebook is made up of small blocks of Julia code (cells) and together they form a reactive notebook | |
| Positron | Positron is a next-generation, free IDE from Posit PBC designed for data scientists that supports both R and Python | |
| PSPP | GNU PSPP is a program for statistical analysis of sampled data. It is a free as in freedom replacement for the proprietary program SPSS | |
| QGIS | QGIS is a Free and Open Source Geographic Information System | |
| Quarto | Quarto® is an open-source scientific and technical publishing system built on Pandoc | |
| R | R is a free software environment for statistical computing and graphics | |
| R-Studio | RStudio is an Integrated Development Environment (IDE) for R | |
| Scilab | Scilab is a free and open-source, cross-platform numerical computational package and a high-level, numerically oriented programming language | |
| Spyder | Spyder is a free and open source scientific environment written in Python, for Python, and designed by and for scientists, engineers and data analysts | |
| Superset | Apache Superset is a modern, enterprise-ready business intelligence web application | |
| Tabula | Tabula is a free tool for extracting data from PDF files into CSV and Excel files | |
| Veusz | Veusz is a scientific plotting and graphing program with a graphical user interface, designed to produce publication-ready 2D and 3D plots | |
| Visidata | Visidata is an interactive multitool for tabular data. It combines the clarity of a spreadsheet, the efficiency of the terminal, and the power of Python, which can handle millions of rows with ease | |
| VSCodium | VSCodium is a community-driven, freely-licensed binary distribution of Microsoft’s editor VS Code (ready with plugins for R/RMarkdown, Python/Jupyter, Julia) | |
| Weka | Weka is a GUI and collection of machine learning algorithms for data mining tasks | |
| WxMaxima | wxMaxima is a document based interface for the computer algebra system Maxima | |
| Zeppelin | Web-based notebook that enables data-driven, interactive data analytics and collaborative documents with SQL, Scala, Python, R and more |
